
Boston's 311 system shows how the Mass. & Cass crisis is spreading through the city
Reports of needle pickups have risen by 20% in the last year alone, and location data shows that it's spreading deeper into the South End, Roxbury, and Dorchester

I have a dog now, blame her for my lack of posts. Something housing-related up next.
Anyone who lives in Boston (or reads the Herald) is familiar with ‘Mass. and Cass’, our version of ‘Methadone Mile.’ Located near Boston Medical Center at the intersection of Melnea Cass Boulevard and Massachusetts Avenue — between the South End, Dorchester, and Roxbury — it has become a haven for open-air drug use, violent crime, homelessness, and general urban disorder that people often associate with ‘Democrat-run cities’. It has become a cudgel against Mayor Wu, particularly by Josh Kraft while he was running a Not Very Good campaign.1
People now contend the problem isn’t just getting worse, but it’s spreading, particularly to other parts of the South End. In July, a 4-year-old stepped on a needle near Moakley Park in South Boston, a terrifying encounter that justifiably worries parents everywhere. That said, there can be a tendency to overstate crime and disorder issues in cities based on anecdote.2 It’s a favorite pastime of the Trump administration, which has used it as a flimsy pretext for fascistic military deployments to terrorize American citizens.3
With that said, a deep dive into the data reveals that the drug abuse and disorder from Mass. and Cass is indeed getting far worse and spreading into new parts of Boston. By tracking Boston 311 reports of loose needles since 2022, some clear trends emerge:
Total needle pickup reports in Boston have risen by 75% since 2022 and by 20% since just last year. Reports accelerated in 2024 and remain far above the 2022-23 average.
Mass. and Cass is still the center of the crisis, but needle reports have more than doubled in surrounding areas. However, areas surrounding Andrew and Newmarket Square have seen decreases.
Parts of the South End immediately surrounding Mass. and Cass have seen the largest increases, with needle reports increasing by 200-300% over the last two years. Parts of Roxbury, Dorchester, and Back Bay have also seen substantial increases.
From the South End to deep into Roxbury and Dorchester, the shadow of Mass and Cass is looming over the city. Despite years of concerted effort, the problem is growing and spreading further than before.
The Mass. and Cass crisis emerged years ago at the nexus of local policy choices and national trends, including the opioid crisis, the closure of Long Island (a former treatment facility located in Boston harbor and the subject of a long-running feud with the mayor of Quincy4), the cost of living, and Covid. Both the government and private groups have tried, with little success, to address the problem. As with similar neighborhoods elsewhere (the Tenderloin, Skid Row, Kensington, etc.), it has proven remarkably resistant to both the carrot and the stick. In response to continued problems in the area, Wu is promising to flood the area with police cadets, but there’s little reason to think this will work when similar sweeps in the past haven’t.
As a resident of Boston and someone who lives and walks his dog around the area, I am not blind to the problem (a walk down Albany St. under 93 is never pleasant). But given that some of the people who talk about it are those who catastrophize about urban crime in Boston, I wanted to see what the data could tell me. One way to do this is by looking at reports made via Boston’s 311 system, which allows residents to file complaints about issues like illegally parked cars or loose needles on the ground, the latter of which is of interest to us. Each report is timestamped and geolocated, allowing us to map and track reports over time. Needle reports are a helpful proxy for the spread of the type of disorder and crime endemic to Mass. and Cass. It isn’t the be-all and end-all, but it lets us at least see if our priors are correct. I can anticipate some questions, which I address at the bottom of the article. But let’s dive in.
Reaching new heights and spreading further
As the chart at the top of the article shows, my analysis of 311 reports reveals that needle pickup reports in Boston through September 2025 have increased by more than 75% compared to the same period in 2022. There’s been a greater than 20% increase since just last year. It’s entirely possible that by the end of 2025, the number of reports will have doubled in just three years. That’s over 9,500 individual reports for needle pickups this year in Boston, compared to 5,400 in 2022.
To account for the possibility that more people may just be using 311, we can look at the total number of 311 reports and compare the trend to our needle data. Looking at the same time period, all 311 reports are only up 2%. People could be much more diligent about reporting needles, but the increase is massive regardless.
The trend of needle reporting is highly cyclical, peaking in late summer and falling to a low around February. This makes sense and mirrors the general trend of 311 — fewer people outside, snow covering things makes it harder, etc. But, remarkably, the increase in the warm months has been much higher in the last two years. Reports increased by 70% from February-March of this year, and the moving average shows just how much the baseline has increased since 2022. Indeed, the largest increase came from 2023 to 2024, and Boston appears to be on a new, much more grim trend since then.
Incidentally, the largest action against Mass. and Cass came in October and November of 2023 with a more aggressive and comprehensive ‘sweep’ of encampments and people in the area, enabled by a new city ordinance. Since then, most tent encampments have disappeared in that specific area, and overdoses are down. But a quick walk through the area and surrounding neighborhoods would tell you that the problem is far from solved. The data tells us that it may have only accelerated and spread the most visible disorder that was once more contained.
The 311 data provides us with the coordinates of each report, accurate to within a street address,5 and we can use that to construct a heat map of needle reports through September for 2023 and 2025.
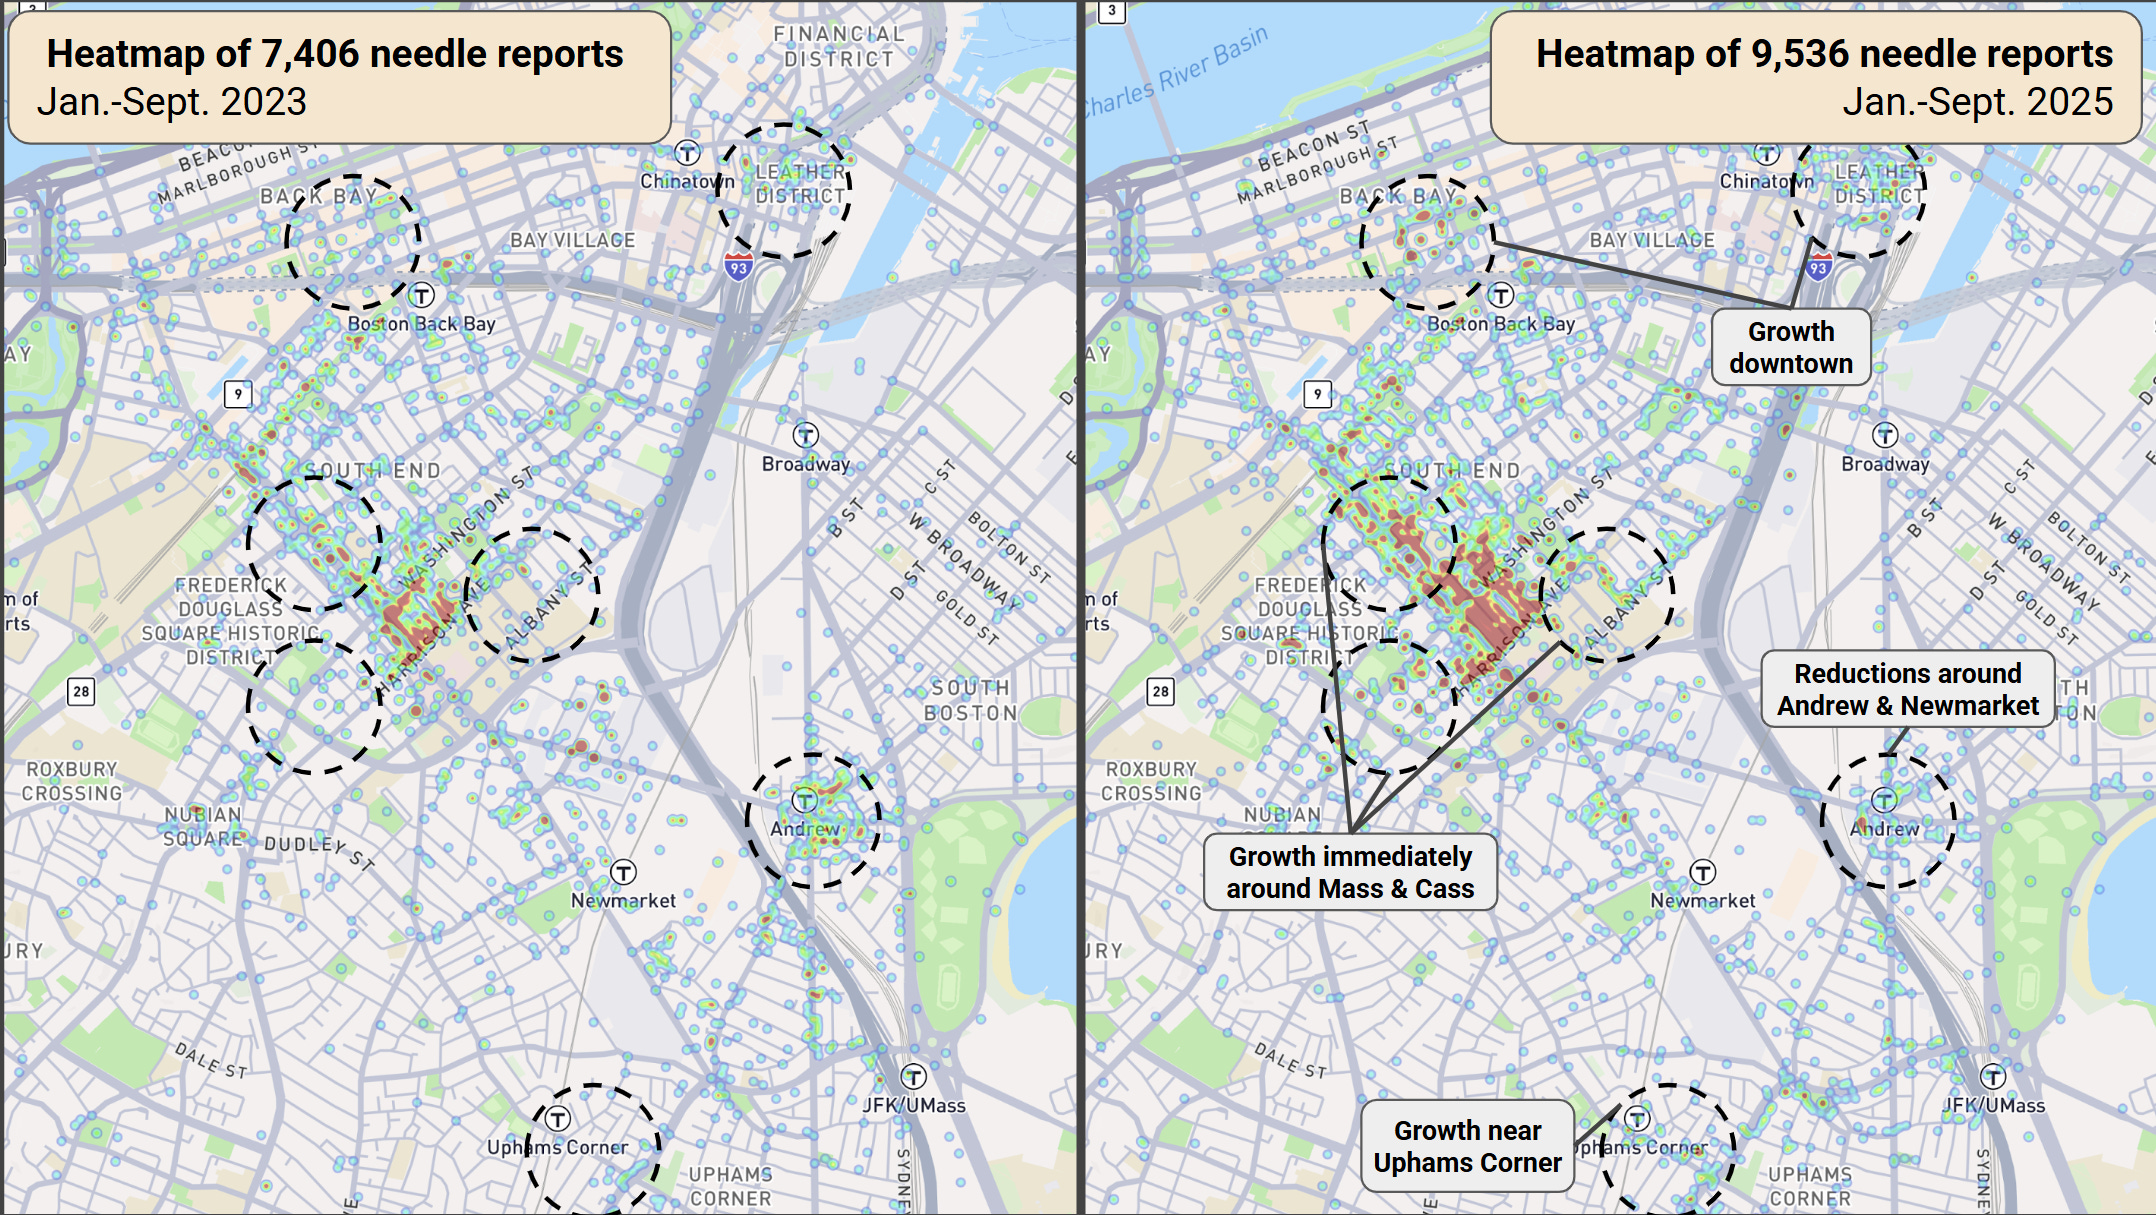
The epicenter of Mass. and Cass is obvious, as are other hotspots of drug use around Boston. But what’s most interesting is the growth (and reductions) over the last two years. Much of the increase in reports has come from existing problem areas. But there’s an obvious spread of reports to the east, west, and particularly the north of BMC. Areas downtown also have a higher density of reports, and there’s a slight increase around the Uphams Corner T stop. It’s not all bad — there’s an obvious decline in the areas around Andrew and Newmarket (the needle that stabbed the child was incidentally found in a park near Andrew).
The heat map seems to confirm the story that the issues are spreading out into the South End, but we can go a step further. There are roughly 200 census tracts that evenly divide Boston, and we can place each report into one of those areas to track trends. Census tracts are good because they are contiguous, relatively compact, and have similar populations (averaging about 4,000 people), making them easily comparable. As you might assume, the distribution of needle reports is highly skewed – just a few tracts see the vast majority of reports.6
Of the 207 tracts in Boston, around half of them had fewer than 10 needle reports in 2025. But just 20 census tracts had over 100 reports each. Combined, these 20 tracts make up a staggering 71% of all needle reports in the city so far this year, despite representing less than 10% of Boston’s population. Census tract 711.01, immediately around BMC, had 1,700 reports and by itself represents 18% of all needle reports in the city in 2025 (that’s double the total through the same period in 2023). In some ways, the epidemic is getting more concentrated. The top 20 census tracts contained 63% of all reports in 2023, while in 2025, the top 20 tracts made up nearly three-quarters of all reports.
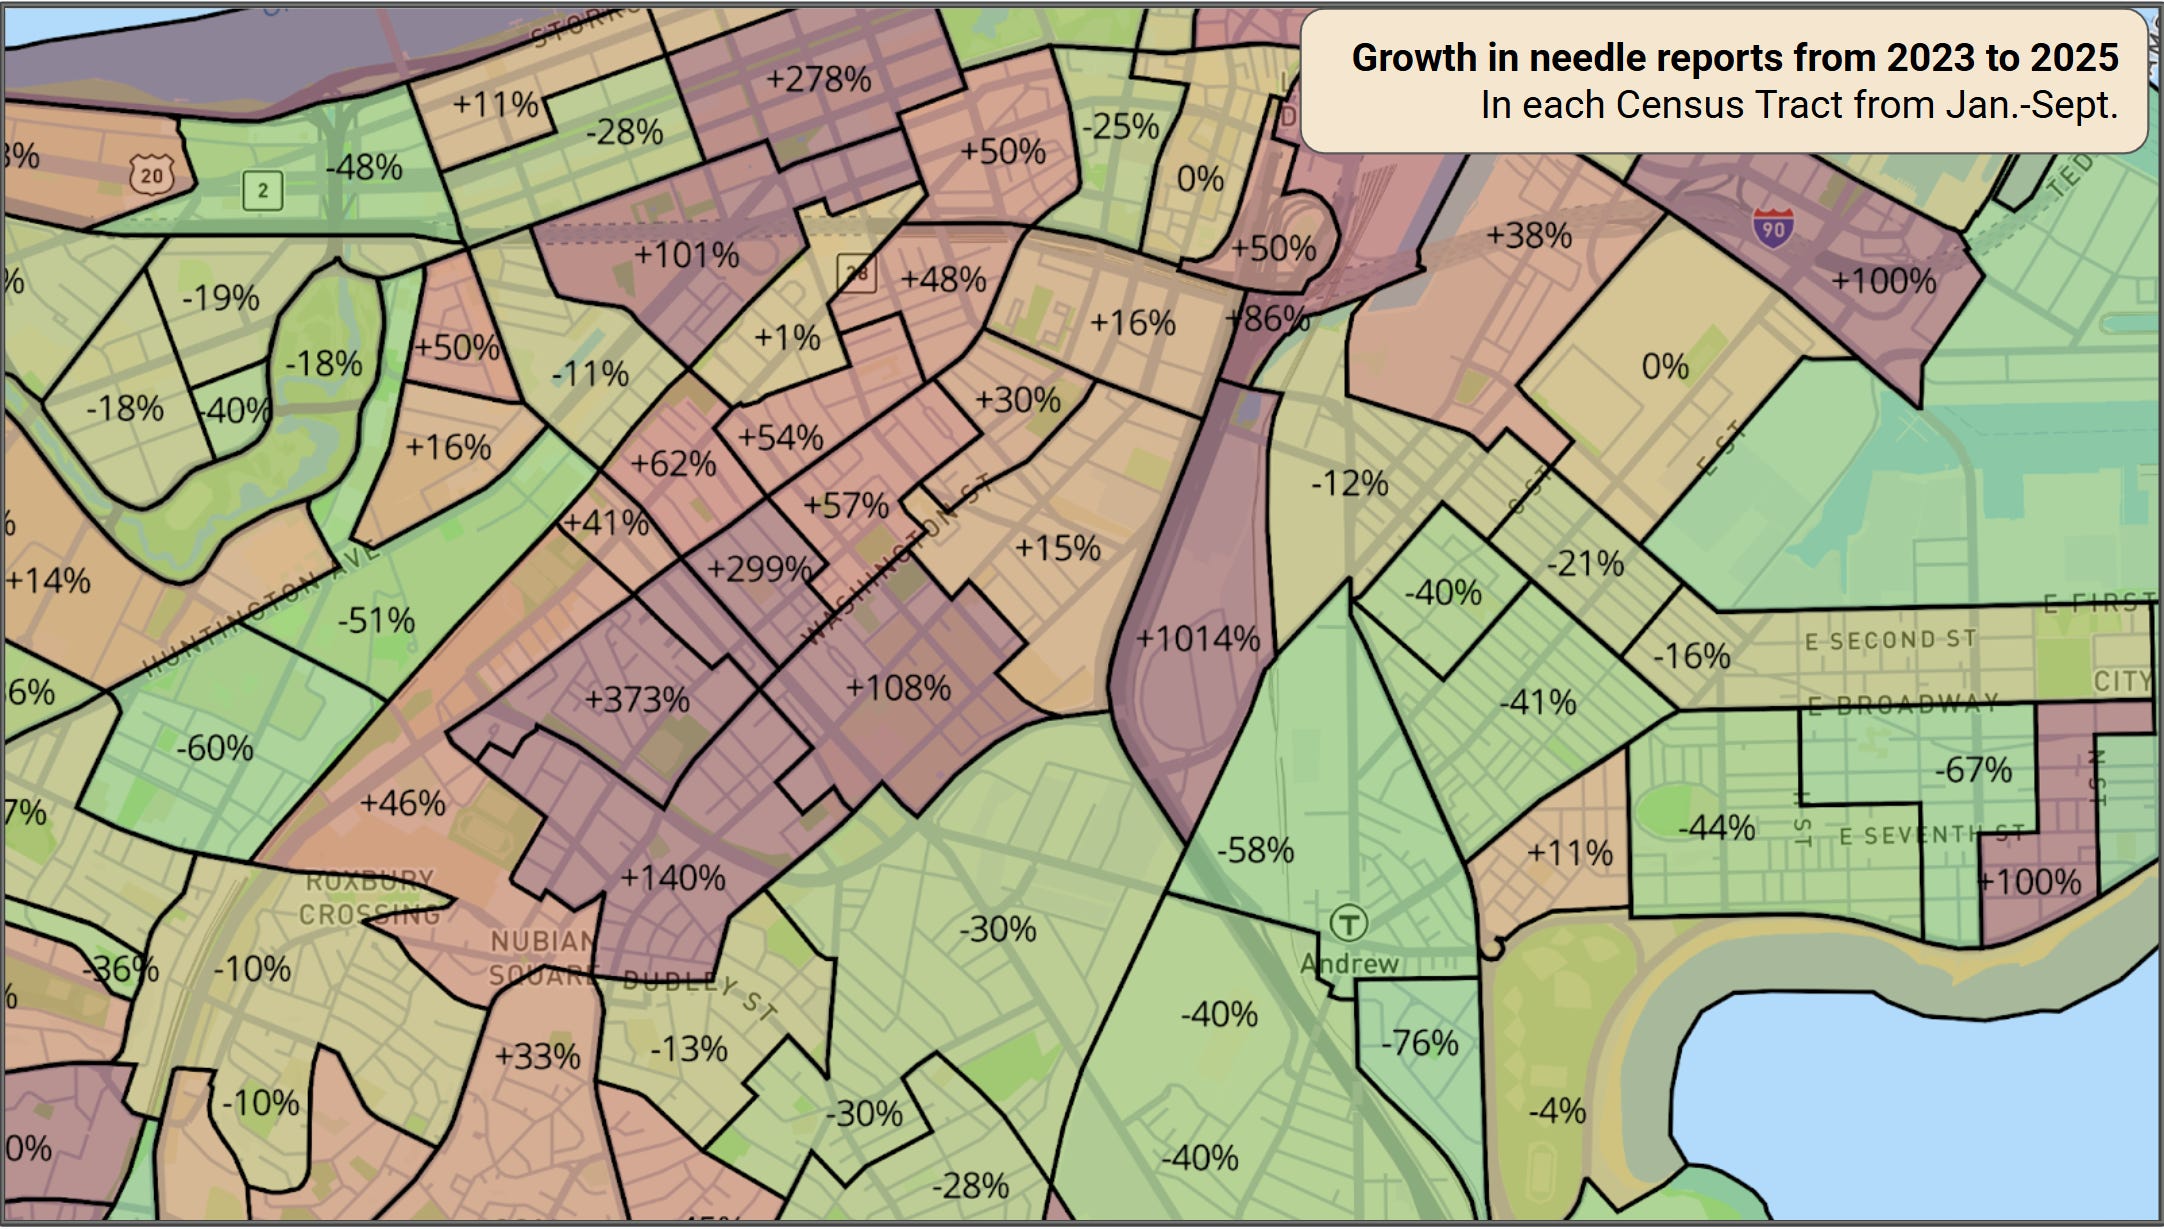
Above is a map of the percentage change in needle reports in each census tract since 2023, centered on Mass & Cass. While reports have increased 30% since 2023 city-wide, increases are unevenly distributed. What emerges is a stark divide – areas south and east have seen significant reductions, while the South End has seen huge increases. The three census tracts just north of Washington and south of Tremont have seen a staggering average increase in reports of 274%. The tract centered around Ramsay Park had 37 reports of needles by this time in 2023. In this year? 175. Other areas of the South End and towards Back Bay and Copley have also seen far more needles (I can personally confirm). The tracts around Upham’s Corner area have seen around a 150% increase. The map shows a broad decrease across many parts of the city, but this is something of an artifact of a lower baseline. Tract 801, just south of Mass. and Cass, decreased from 700 to 500 reports — a genuine improvement. But many others saw much smaller absolute decreases: from 12 to 8 or 9 to 6, so this map is imperfect.
Lessons
As it turns out, the data does validate what our eyes tell us. Based on at least 311 reports (as a rough proxy for visible disorder), the issue is getting much worse. That’s true for the epicenter of Mass. and Cass, and it’s true for people in surrounding communities having their lives disrupted. The South End is facing the brunt of the problem, although my data also shows that parts of Roxbury and Dorchester are seeing huge increases.7 Some of the loudest voices on the problem aren’t speaking in good faith or don’t actually have any solutions to the issue. But they aren’t wrong.
The city has tried and failed for years to solve the issue. If anything, the data shows how the latest attempt at sweeps may have only made the problem worse. I don’t know the solution to Mass. and Cass, but it’s clear we need to try more. It’s easy for liberals to handwave complaints about blue cities as conservative nonsense (although they really shouldn’t). But the data is telling a clear story here, and there needs to be action.
Methodology
Q: I read that one person makes all the airport noise complaints; couldn’t that be happening here?
A: Good thought, but unlikely. We’re provided with specific location data so it’s possible to see exactly where reports are clustered. No single location accounted for more than 2% of reports, and the large single spot was located right outside BMC, which is logical.
Q: Can’t we use crime statistics or overdose cases or something else?
A: Sure, and that could be interesting in the future. The 311 database is good because it has lots of information, is consistently updated, and there’s a lot of data, so we can be very granular. Much easier to see a trend when n=10,000 vs. n=100.
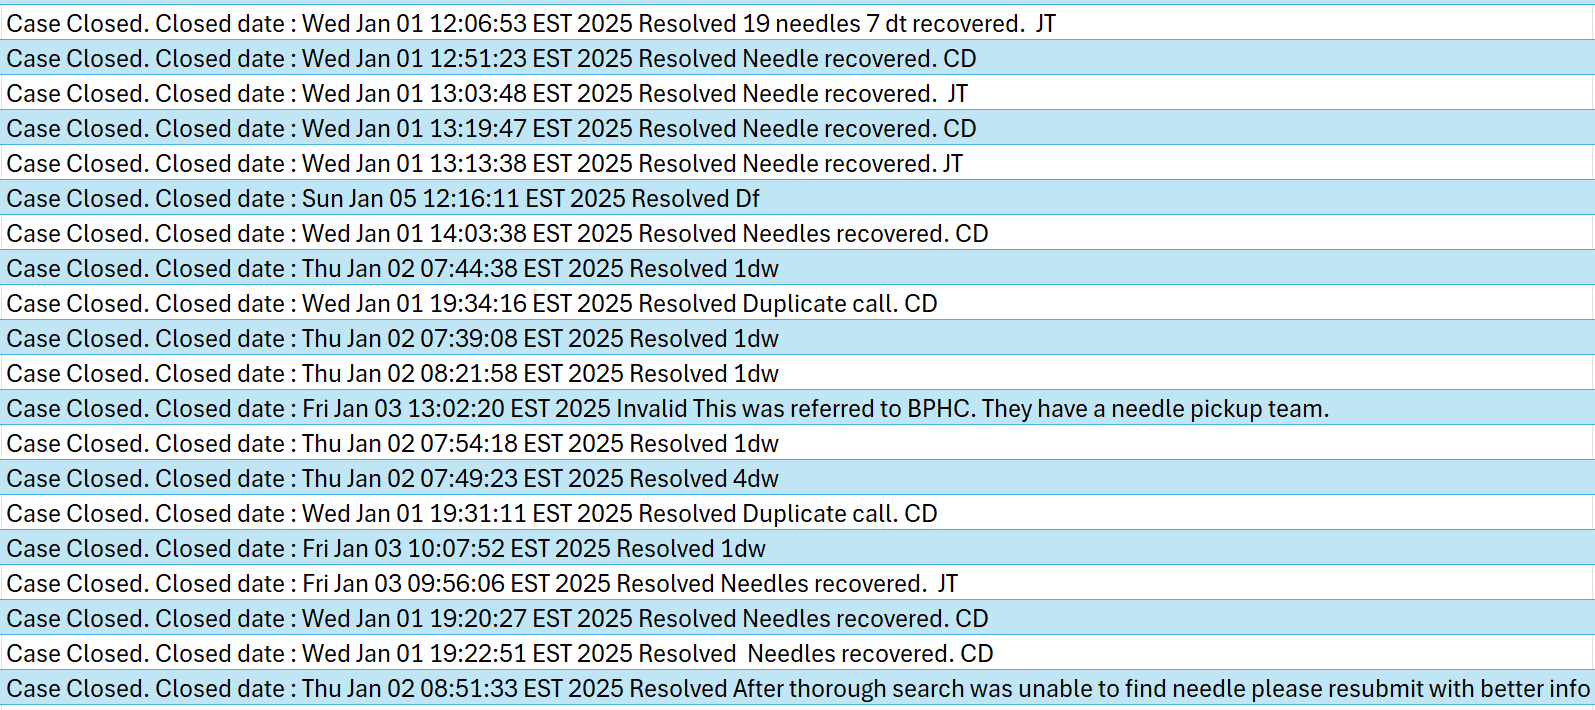
Q: Couldn’t a lot of these be fake complaints or not actually needles?
A: Yes, some are. One issue with the data is that the text content of the complaints is inconsistent, so it’s hard to account for all of the information. A few examples of what I mean are below. Looking at just the first 50 reports in 2025, we have 30 reports where they explicitly recover needles (as many as 19 at once!), another 13 where it’s implied they did, 4 duplicate calls, and 3 where they couldn’t find them. So while the raw number of reports overstates the actual needle reports, I don’t think it’s substantial enough to impact the conclusion (subtract 5% from all my numbers if you want). And given that some cases involve dozens of needles found, if you sum those all up, it’s likely my numbers vastly understate the number of needles found. Some examples of the reports below for context:
The Krafts are very lucky that Drake Maye is balling out, or else the family name would really be in the dirt.
See: Donald Trump’s threats to take away World Cup games from Gillette, which is notably not close to Boston.
Who recently claimed that clergy sexual abuse in Boston was ‘homosexual issues, not pedophilia’ before clarifying that sexually assaulting teens is technically not pedophilia, which I assume means it is okay. No, this is not a joke.
This occasionally results in some weirdness with big industrial lots, but it works really well 99% of the time.
In 2025, the average number of reports per tract was 46, while the median was 8. The histogram for the data was basically unreadable.
Excellent analysis. Sobering to see urban issues spred like this.